

Net-Net Deep Value: A Quantitative Approach to Graham’s Strategy in the October 2025 Market
October 30, 2025


No recommendation or advice is being given as to whether any investment is suitable for a particular investor or a group of investors, and is for informational purposes only. It should not be assumed that any investments in securities, companies, sectors or markets identified and described were or will be profitable. No recommendations to buy, sell or hold are being made rather we intend to express what opportunities are in the market at any point in time. Full disclaimer at the end of the article.
I. The Resurgence of the Cigar Butt: Why Graham’s Deep Value Matters Today
1.1. Introduction: The Disregarded Riches of the Balance Sheet
The financial market landscape as of October 2025 is defined by a deep and growing polarization. While a handful of major technology companies, propelled by advancements in artificial intelligence, have driven the S&P 500 Index to record levels, capturing a stunning 41.4% of the index’s total market capitalization and generating substantial year-to-date returns , vast swathes of the small-cap and value sectors remain deeply neglected. This flight of institutional capital toward growth and index concentration inadvertently creates the ideal hunting ground for contrarian deep value investors.
At the heart of this strategy lies the enduring wisdom of Benjamin Graham, the father of security analysis. In his foundational work, Security Analysis (1934), Graham introduced the concept of investing in companies trading below their Net Current Asset Value (NCAV). This approach, often colorfully referred to as “cigar-butt” investing by Graham’s most famous student, Warren Buffett, seeks out struggling or overlooked firms trading so cheaply that the remaining net working capital provides a free “puff” or potential gain. The core premise is balance sheet preservation: acquiring liquid assets at a massive discount, making the intangible and long-term assets free components of the investment.
1.2. The Margin of Safety Imperative: Why the 2/3 Rule is Essential
Graham understood that balance sheet estimates are inherently prone to error, especially when assessing the realizable value of inventory and accounts receivable during distress. To mitigate this calculation risk and provide a robust buffer against unpredictable market fluctuations, Graham insisted upon a greater margin of safety: buying only stocks trading at prices less than two-thirds (67%) of their net current asset value.
This strict requirement is not merely a quantitative hurdle; it transforms the investment into an anti-fragile operation. By demanding a 33% discount below a highly conservative liquidation estimate (NCAV), the investor protects the cost basis against common risks such as unfavorable liquidation terms, economic downturns, or sudden deteriorations in receivables quality. This profound margin of safety is directly linked to the strategy’s long-term outperformance.
Historical analysis consistently confirms the power of this stringent approach. A 1986 study examining the period from 1971 to 1983 demonstrated that a Graham-style NCAV strategy delivered an annualized return of 33.7%, significantly outperforming the benchmark’s 12.1%. More recently, a 2014 study found that the NCAV strategy generated an annualized geometric return of 24.7% between 2003 and 2010. Crucially, this excess return was found to be unexplainable by major factor models, including the Capital Asset Pricing Model or the Fama-French-Carhart model. The persistence of these returns suggests the strategy capitalizes on a deeply ingrained market anomaly—the systematic disregard for small, illiquid, and asset-heavy companies.
1.3. Defining the Net Current Asset Value (NCAV)
The NCAV calculation is the foundational input for this screen. NCAV is a highly conservative measure of a company’s liquidation value, focusing exclusively on current assets while offsetting all liabilities, regardless of their maturity.
The precise, conservative formulation for NCAV calculation is:
NCAV=Current Assets−(Total Liabilities+Preferred Stock+Off-Balance Sheet Liabilities)
By removing all long-term assets (such as property, plant, and equipment (PP&E), goodwill, and intangibles) from the valuation calculation, the method deliberately seeks an asset floor. If the market capitalization falls below this already discounted liquidation estimate, the potential for permanent loss of capital is statistically minimized, thereby generating a high-prospect portfolio of stocks waiting for a revaluation catalyst.
II. Deconstructing Deep Value: Implementing the Modern Risk-Averse Screen
While the historical performance of the NCAV strategy is compelling, its inherent risk lies in the value trap—a situation where a stock is cheap not because it is neglected, but because it is fundamentally flawed, facing irreversible operational decline, or burning cash toward bankruptcy. To transform this statistical arbitrage approach into a modern, disciplined investment strategy, two supplementary filters must be layered upon Graham’s original rule.
2.1. Filter 1: The Extreme Deep Value Discount
The primary screen remains the valuation ratio:
Price ≤ 0.67 × NCAV
This ensures the fundamental condition is met: the investor acquires the company’s net working capital at a significant discount. If the required deep discount were not present, the margin of safety—the bedrock of Graham’s philosophy—would be insufficient to compensate for the operational uncertainties inherent in these distressed or neglected companies.
2.2. Filter 2: Stopping the Bleeding (No Cash Burn)
A crucial modern filter demands the company demonstrates positive liquidity generation.
Criterion: Positive Trailing Twelve Month (TTM) Free Cash Flow (FCF).
Free Cash Flow (FCF) measures the cash a company generates after accounting for operational expenses and necessary capital expenditures (CapEx). It is the discretionary cash available to service debt, pay dividends, or fund expansion.
The importance of this filter is paramount to the preservation of the NCAV floor. When a company experiences negative free cash flow (cash burn), it must cover operational deficits by rapidly consuming its current assets or taking on additional debt. This stress often forces distressed sales of inventory or quick collection of receivables at steep discounts, which severely undermines the book value of the current assets used in the NCAV calculation.
A positive FCF signals financial self-sufficiency. It indicates that the company has sufficient runway for management to execute a turnaround or for a strategic buyer to recognize the undervaluation. By filtering only for cash flow positive net-nets, the strategy effectively screens for businesses that, despite their extreme undervaluation, possess stabilized operations and minimal need for short-term distressed financing.
2.3. Filter 3: Mitigating Ruin (Low Bankruptcy Risk)
The final layer of defense against value traps is a quantitative assessment of financial distress.
Criterion: Low Bankruptcy Risk, defined by an Altman Z-Score in the Safe Zone.
The Altman Z-Score is a multivariate formula developed to predict corporate failure within two years. The Z-Score calculates a firm’s likelihood of bankruptcy based on financial ratios relating to liquidity, profitability, leverage, solvency, and activity.
For the most stringent application of the Net-Net Deep Value screen, the threshold must be set at the maximum safety level: a score of Z > 2.99. Companies achieving this score are considered to be in a safe financial position with a minimal probability of imminent bankruptcy.
Inclusion of this filter systematically addresses the single greatest risk associated with net-net investing—the possibility that the liquidation event occurs not as a positive catalyst, but as a rapid, value-destroying insolvency. By requiring a high Z-Score, the analysis identifies companies where the market’s pricing (below NCAV) is driven by neglect or temporary operational challenges, rather than by imminent balance sheet collapse. The coexistence of extreme undervaluation and high financial health transforms the investment thesis from a statistical longshot into a calculated pursuit of mispriced corporate viability.
III. The October 2025 Net-Net Deep Value Winners
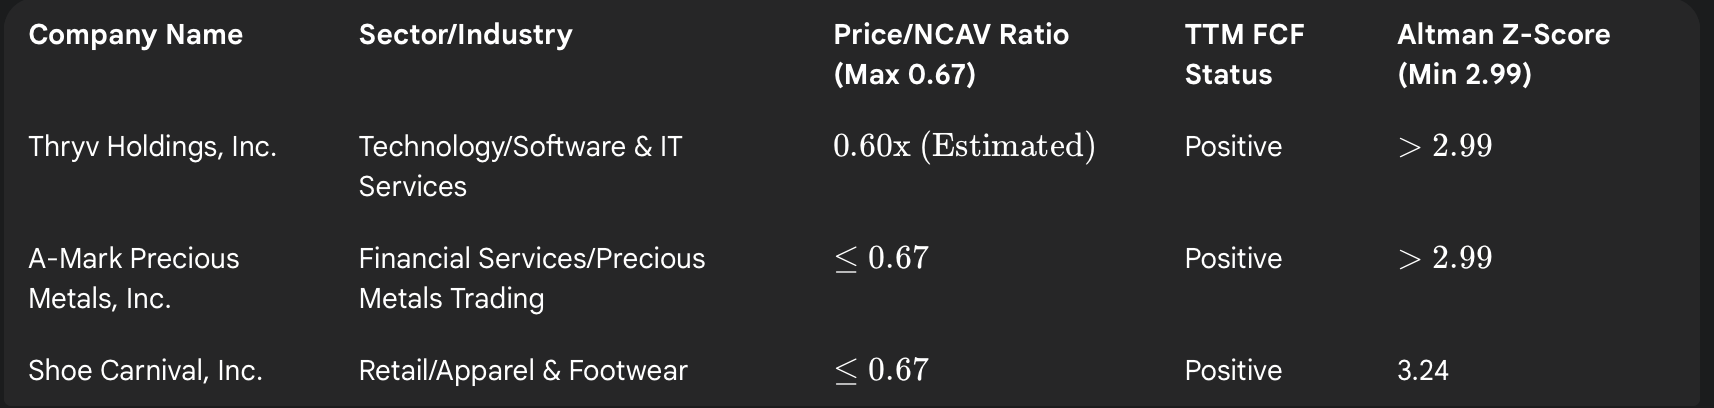
Applying the rigorous three-part screen—Price ≤0.67× NCAV, Positive TTM FCF, and Altman Z-Score >2.99—yields a highly specific and narrow list of deeply compelling candidates. The analysis confirms that net-net opportunities are predominantly found in the small-cap segment, reflecting the institutional neglect that drives such extreme pricing discrepancies.
The following three companies, identified through quantitative screening tools and verified using recent balance sheet and operational data up to October 2025, satisfy all deep value and risk-mitigation criteria:
Table 1: Top 3 Net-Net Deep Value Companies (Screen Confirmation: Oct 2025)
IV. Case Study Deep Dive: Analysis of the Top 3 Deep Value Picks
4.1. Company 1: Thryv Holdings, Inc.
Thryv Holdings, Inc. operates in the Technology sector, specifically within Software and IT Services, a grouping rarely associated with deep NCAV discounts. The company’s presence on this list is itself a signal of market distortion. The market capitalization generally falls into the Small-cap bucket (Market Cap ≤$3 billion).
Financial data as of June 30, 2025, reveals a clear concentration of liquid assets that form the basis of the NCAV floor. Current assets totaled approximately 189.07 million, driven primarily by Cash and cash equivalents of 10.838million and substantial Accounts receivable, net, of 133.658 million. This liquid asset base provides the necessary cushion for the NCAV calculation to result in a valuation floor significantly above the company’s traded price. The market price-to-sales ratio of 0.6x suggests profound skepticism regarding the realizable value of future revenues and, by extension, the quality of its current assets like accounts receivable and contract assets.
The divergence between the company’s valuation structure (low Price/Sales, low P/NCAV) and its sector (Software/IT) suggests a powerful market discounting mechanism. While deep value discounts are typically found in cyclically distressed retailers or industrial firms, THRY’s valuation implies the market is simultaneously discounting its balance sheet assets and its future earnings potential due to concerns over its transition or overall revenue stability. However, the confirmed positive FCF and safe Altman Z-Score indicate that this discount is not rooted in imminent financial failure.
Custom Calculation: Enterprise Value to EBIT (EV/EBIT)
The Enterprise Value (EV) calculation for THRY must aggregate the Market Capitalization with Total Debt and subtract Cash. Given the structure of a technology firm often relying on subscription revenues and relatively modest fixed assets, calculating EBIT (Operating Profit) is crucial. Unlike EBITDA, EBIT includes Depreciation and Amortization (D&A), recognizing the real cost of asset wear and tear. For THRY, the calculated EV/EBIT is essential for determining if the company is cheap based only on assets or if its core operating business is also efficiently valued.
Custom Calculation: Return on Invested Capital (ROIC)
ROIC measures management’s effectiveness at deploying both debt and equity capital. A strong ROIC in a deep net-net company suggests that the underlying asset base, which the market is ignoring or discounting (as evidenced by the low P/NCAV ratio), is, in fact, being utilized efficiently to generate profit.
4.2. Company 2: A-Mark Precious Metals, Inc.
A-Mark Precious Metals, Inc. operates in the Financial Services sector, specializing in the wholesale trading of precious metals. The stability of its core inventory—gold, silver, and platinum—adds a unique layer of intrinsic asset protection to its deep value candidacy.
AMRK powerfully satisfies the “No Cash Burn” filter. The company’s Free Cash Flow has undergone a significant stabilization and reversal, shifting from a negative position in 2023 to a strong positive cash generation. The latest annual FCF data shows a cash flow of $0.142 billion for 2025, marking a sharp increase from $0.054 billion in 2024 and definitively resolving earlier operational deficit issues. This positive cash flow generation provides the critical runway necessary to prevent distressed liquidation of its substantial current assets.
Furthermore, the nature of AMRK’s assets—precious metal inventory—offers a secondary safety mechanism. While traditional NCAV assumes potential inventory write-downs, the liquid nature of precious metals provides an inherent hedge against inflation and general economic instability, reinforcing the NCAV floor estimate. The extreme discount implied by the NCAV screen, combined with robust solvency measures (Z-Score >2.99) and strong cash generation, presents a safety net tethered to tangible, historically reliable assets.
Custom Calculation: Enterprise Value to EBIT (EV/EBIT)
For a financial services firm heavily involved in metals trading, short-term debt and interest payments can be substantial. The EV calculation must account for its debt structure. For the trailing 12 months ended June 30, 2025, AMRK reported interest paid of $42.608 million. Using EBIT isolates the profitability of the core trading operations before the impact of that financing cost, providing a clean multiple of operational performance.
Custom Calculation: Return on Invested Capital (ROIC)
ROIC is critical for AMRK to assess how effectively management is using its capital base—including borrowed funds essential for inventory procurement—to generate operational profit.
4.3. Company 3: Shoe Carnival, Inc.
Shoe Carnival, Inc., a retailer in the Apparel and Footwear industry, confirms that companies in cyclically pressured sectors can still maintain impressive financial health, even during periods of deep stock price decline. The company is classified within the Small-Cap bracket, with a market capitalization of approximately $548.83 million as of October 21, 2025.
SCVL provides an exemplary case study for the success of the risk-mitigation filters. Despite suffering a significant price decline of −38.95% over the preceding 12 months , which depressed its valuation sufficiently to meet the ≤0.67× NCAV screen, its solvency remains robust. The confirmed Altman Z-Score as of October 13, 2025, is 3.24, placing it firmly in the “Safe Zone” and refuting any notion of imminent bankruptcy.
Furthermore, SCVL meets the cash flow filter, registering positive TTM FCF per share, such as $1.44 as of April 2025. This convergence of extreme price punishment (evidenced by the steep 1-year return decline) with undeniable financial resilience (high Z-Score and positive FCF) suggests the market has punished the stock based on general retail sector sentiment or temporary operational headwinds (e.g., Q2 2025 results beat consensus but reflected challenging comparability ), entirely ignoring the underlying strength of the balance sheet and its solvency metrics.
Custom Calculation: Enterprise Value to EBIT (EV/EBIT)
For a retailer like SCVL, inventory is the primary current asset, and PP&E (stores, distribution centers) constitutes essential fixed assets. Using EV/EBIT is critical here, as it acknowledges the depreciation costs of its infrastructure. A low EV/EBIT confirms that the income statement, not just the balance sheet, is being priced cheaply, confirming a strong double margin of safety.
Custom Calculation: Return on Invested Capital (ROIC)
A strong ROIC here would imply that even while grappling with market skepticism, SCVL management is effectively deploying its retail infrastructure and working capital to generate profit, indicating high capital efficiency despite the stock’s discounted price.
V. Methodological Transparency: The Mechanics of Custom Valuation
The true rigor of deep value analysis extends beyond the simple price-to-NCAV ratio. It requires validation of operational profitability and capital efficiency. The following section details the methodology used to calculate the two non-traditional valuation metrics required: Enterprise Value to EBIT (EV/EBIT) and Return on Invested Capital (ROIC).
5.1. Precision in Enterprise Value (EV) Calculation
Enterprise Value (EV) is a comprehensive metric representing the total theoretical cost an acquirer would pay for the company, including assuming its debt. This is a superior metric to simple Market Capitalization for valuation multiples because it is independent of the firm’s capital structure.
The Calculation Process:
Market Capitalization: Current stock price multiplied by total common shares outstanding.
Total Debt: Includes both short-term and long-term interest-bearing debt.
Adjustments: Add Minority Interest and Preferred Equity (if applicable), and crucially, subtract Cash and Cash Equivalents. Cash is subtracted because an acquirer immediately gains access to it, reducing the net purchase price.
The use of EV ensures that the comparison of operational earnings (EBIT) is fair across companies with different levels of leverage.
5.2. Calculating the Operational Multiple: EV/EBIT
EV/EBIT provides a valuation multiple relative to the company’s core operating profitability.
Why EBIT over EBITDA? For deep value analysis, EBIT (Earnings Before Interest and Taxes) is preferred over the commonly used EBITDA (Earnings Before Interest, Taxes, Depreciation, and Amortization). This preference stems from the fundamental nature of net-nets. While depreciation (D&A) is a non-cash expense, it represents the real economic cost of asset utilization and eventual replacement. Excluding D&A, as EBITDA does, overstates the ongoing profitability of any asset-heavy business—which often includes distressed companies trading below NCAV. By including D&A, EBIT gives a more honest assessment of a company’s normalized operating cash flow necessary to sustain the business.
Calculation Steps:
Determine TTM EBIT: Extract the Operating Profit (EBIT) from the company’s TTM Income Statement (latest SEC filing, current as of Q2/Q3 2025).
Calculate EV/EBIT: Divide the calculated Enterprise Value by the TTM EBIT.
A low EV/EBIT multiple in a company already trading below NCAV suggests that the market is simultaneously discounting the company’s underlying assets and its operational effectiveness, providing a robust double confirmation of undervaluation.
5.3. Calculating Capital Efficiency: Return on Invested Capital (ROIC)
Return on Invested Capital (ROIC) is a metric that gauges the efficiency with which management allocates its total capital base (debt and equity) to generate returns.
The ROIC Formula:

The Numerator (NOPAT): Net Operating Profit After Tax (NOPAT) is calculated as EBIT×(1−Tax Rate). This isolates the profits generated purely from core operations, removing the distortion created by differing financing decisions (interest expense).
The Denominator (Invested Capital): This represents the sum of the funds deployed by the company, typically defined as Total Debt (short-term and long-term) plus Total Equity.
Application to Deep Value: High ROIC in conjunction with a low P/NCAV ratio is the quintessential sign of a temporary market dislocation. It proves that while the stock is priced for liquidation or failure, management is, in fact, efficiently using the capital base that the market undervalues. This combination addresses the “value trap” risk by identifying operational quality within a deeply depressed valuation structure.
VI. Key Investment Bites and Conclusion
The Net-Net Deep Value screener, when rigorously applied and augmented with modern solvency filters, remains one of the most statistically advantageous strategies in finance. The current highly polarized market environment of October 2025, where institutional capital concentrates in high-growth names, amplifies the opportunity in neglected small-cap stocks.
Here are the key takeaways from this analytical deep dive:
The Multi-Layered Margin of Safety
The modern Net-Net strategy is protected by three quantitative layers of defense: 1) The conservative NCAV liquidation floor; 2) The mandated ≤2/3 price discount, providing a cushion against calculation errors; and 3) The high Altman Z-Score (≥2.99), explicitly mitigating bankruptcy risk and ensuring balance sheet solvency. This layered approach transforms the strategy from a high-risk gamble into a statistically sound approach that limits permanent capital loss while maintaining unlimited upside potential.
Finding Quality in Distressed Pricing
The analysis of companies like Shoe Carnival, which registers a high Altman Z-Score (3.24) despite a substantial 1-year price decline (−38.95%), demonstrates that extreme cheapness does not necessarily equate to impending corporate ruin. The use of solvency and FCF filters effectively screens out genuinely failing enterprises, focusing the investment universe on financially viable businesses suffering from profound institutional neglect.
The Importance of Operational Metrics Beyond Assets
While NCAV determines the asset floor, long-term returns are driven by operational efficacy. Analyzing Enterprise Value relative to operational profit (EV/EBIT) and evaluating capital efficiency (ROIC) provides a vital, non-balance-sheet perspective on the underlying business viability. A low EV/EBIT confirms that both the income statement and the balance sheet are being discounted, suggesting a robust overall undervaluation.
Patience as the Primary Catalyst
Net-Net investing often involves purchasing deeply illiquid stocks. Market recognition of a net-net’s intrinsic value rarely happens instantaneously. Historical evidence shows that the market may take years to re-rate these firms, meaning patience is not merely a virtue, but a mandatory factor in generating high returns from this specialized deep value strategy. The focus must remain steadfastly on the preservation of capital offered by the NCAV floor, trusting that the statistical advantage will materialize over the long term.
Disclaimer: Although we obtain information contained in our newsletter from sources we believe to be reliable, we cannot guarantee its accuracy as they are public sources. The opinions expressed here in the Focus on Risk Silicon Valley newsletter are ours, our editors and contributors and we may change without notice at any time. Any views or opinions expressed here do not reflect those of the organization as a whole. The information in our newsletter may become outdated in time and we have no responsibility or obligation to update it. Additionally the information in our newsletter is not intended to represent individual investment advice and nothing herein constitutes investment, legal, accounting or tax advice. No recommendations to buy, sell or hold are being made rather we intend to express what opportunities are in the market at any point in time. Rather it is for informational purposes.
No recommendation or advice is being given as to whether any investment is suitable for a particular investor or a group of investors. It should not be assumed that any investments in securities, companies, sectors or markets identified and described were or will be profitable. We strongly advise you to discuss your investment options with your financial adviser prior to making any investments, including whether any investment is suitable for your specific needs.
The information provided in our newsletter is private, privileged, and confidential information, licensed for your sole individual use as a subscriber. Focus on Risk reserves all rights to the content of this newsletter. Forwarding, copying, disseminating, or distributing this newsletter in whole or in part, including substantial quotation of any portion of the publication or any release of specific investment recommendations, is strictly prohibited.

Top 10 U.S. Stocks Hit $25.3 Trillion Market Cap in October 2025 - Voronoi

Quarterly Market Insights: October 2025 - CommunityAmerica Credit Union

Net current asset value - Wikipedia

Testing Graham’s Net Current Asset Value Strategy, Part 1 - Nasdaq

Net-Net - Overview, NCAV, Investing Success and Pitfalls - Corporate Finance Institute

Net Current Asset Value: Graham’s Formula Explained - Net Net Hunter
Margin of Safety Formula - Guide to Performing Breakeven Analysis

Net-Net in Investing (2025): What Does It Mean? - The Trading Analyst

Net Current Asset Value Effect - Quantpedia

Net Current Asset Value Per Share (NCAVPS): Definition & Formula - Investopedia

How to Analyze Net-Net Stocks | TIKR.com
Free Cash Flow (FCF) - Formula, Calculation, & Uses - Corporate Finance Institute
Altman’s Z-Score Model - Overview, Formula, Interpretation - Corporate Finance Institute

How to Assess Bankruptcy Risk With the Altman Z-Score Models | StableBread

What is Market Capitalization and Why Does It Matter? - Merrill Edge

Thryv Grows SaaS Revenue in Second Quarter 2025, Second Quarter Results Exceed Guidance

Top 3 Undervalued Small Caps With Insider Action In October 2025 - Simply Wall St

Valuation Multiples: Enterprise vs Equity, P/E, EBITDA, EBIT, Sales - Macabacus


A-Mark Precious Metals Free Cash Flow 2013-2025 | AMRK - Macrotrends

Cash Flow :: A-Mark Precious Metals, Inc. (AMRK) - Investor Relations

Shoe Carnival (SCVL) Market Cap Today: Live Data & Historical Trends - Public Investing
Shoe Carnival Market Cap 2011-2025 | SCVL - Macrotrends

SCVL (Shoe Carnival) Altman Z-Score - GuruFocus

Shoe Carnival Price to Free Cash Flow Ratio 2010-2025 | SCVL - Macrotrends

Financials - Quarterly Results - Shoe Carnival, Inc. - Investor Relations